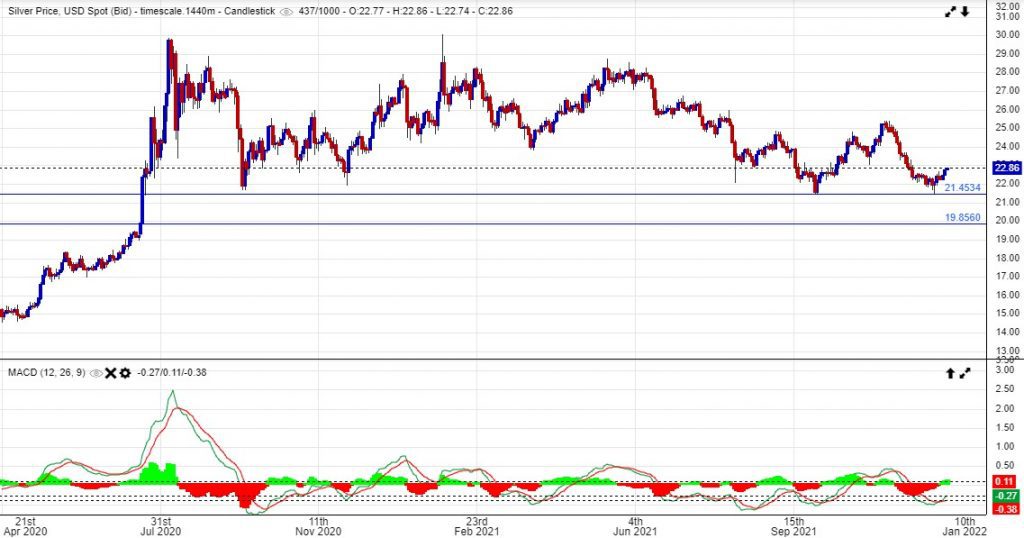
The silver price has upset a few bulls of late, after retreating from a high of USD $25.00 per ounce in November down to a wash-out low of $21.40. But there are some positive indications from the recent price action, hinting that a significant low has now been formed.
From a technical perspective, it was very important for the price to hold this key $21.40 level as it coincides with the recent lows all the way back to the major initial breakout of June 2020. As we see in the chart below, the top of the gap higher in the price at around $21.40 has acted as an area of major support for the silver market in the last 18 months. If silver were to break south of this $21.40 level, you would imagine the bears would have attacked this level ferociously as the gap back towards $20 an ounce would have opened up and stop losses galore would be sitting just below.
Long-Term Silver Daily Chart
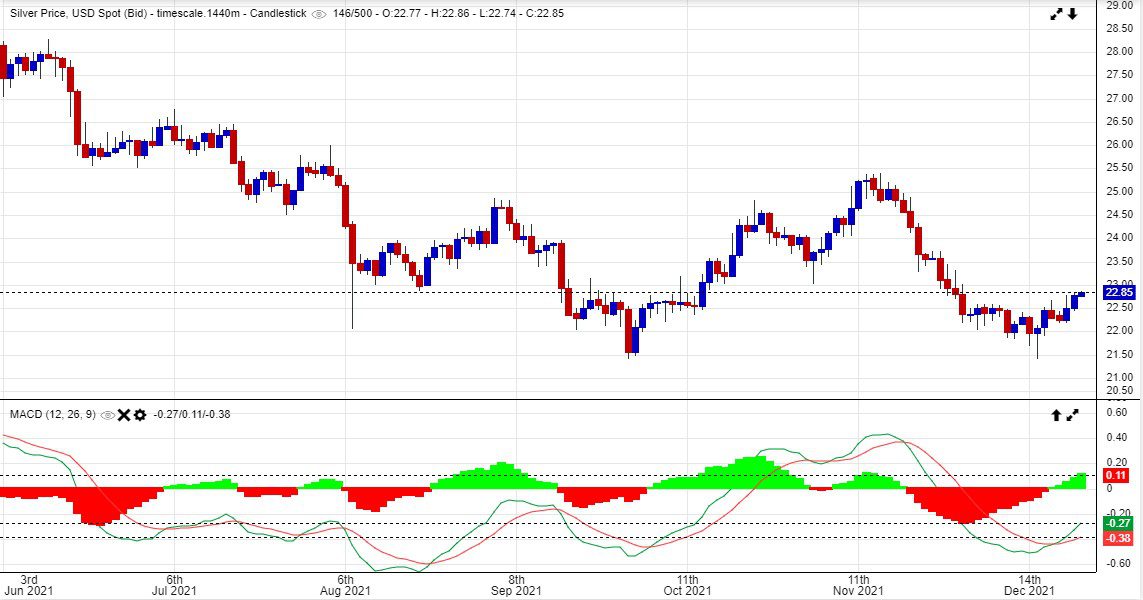
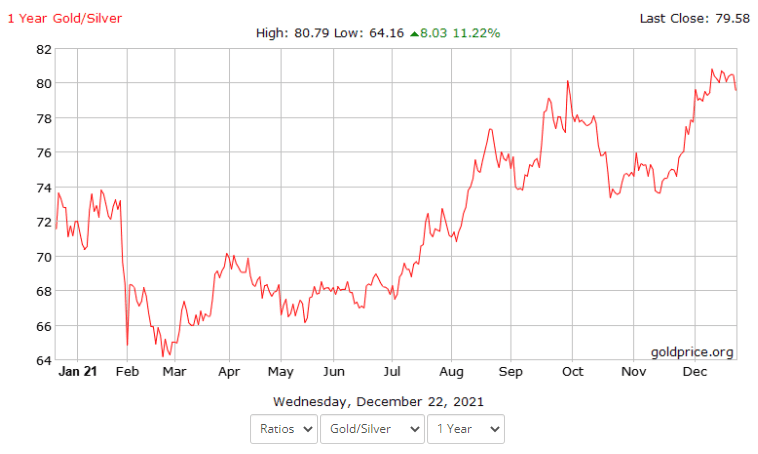
 Zooming in on a more recent time frame we can see it is so far so good for silver, as the market has retraced back to safe territory of $22.86 as we write. The MACD momentum indicator on the daily chart below is also signaling a swing in momentum to the upside from here, and the behavior of the price with a long tail on the daily candle (see below) usually indicates market capitulation or bottoming behavior. With technicals now in favor, don’t be surprised to see the gold: silver ratio start pulling back and silver outperforming in the short-term; eyeing $24.00 USD. The gold:silver ratio seems to have peaked above 80:1 and due a drop from this extended level.
Short-Term Silver Daily Chart
Gold:Silver Ratio- 1 Year
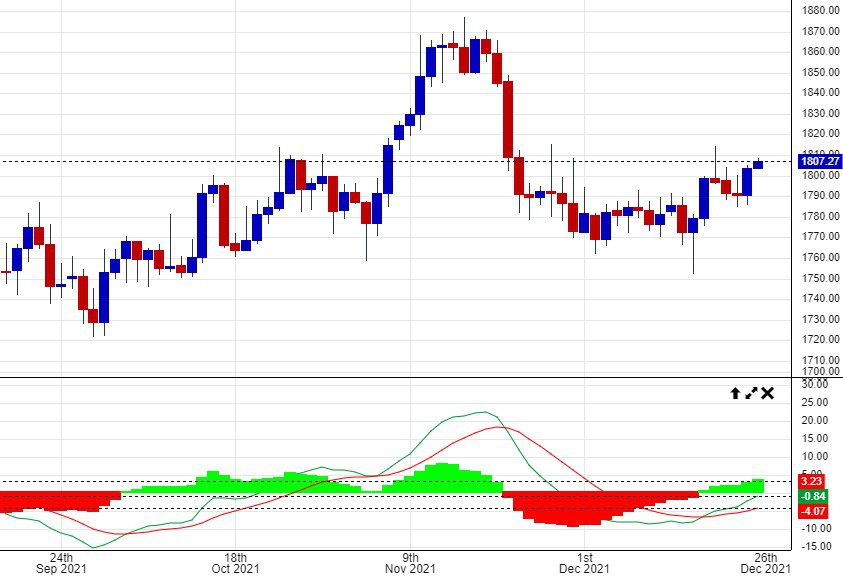
 To the US gold price now, and it is a similar story from a technical standpoint, as the market manages to trade above $1,800 once again with momentum swinging in favor of the bulls. It is positive to see any strength in the market right now on the backdrop of the very recent hawkish commentary out of the Federal Reserve. Fed officials have said monetary stimulus is apparently going to end much sooner than previously thought, potentially ending in March of 2022. The gold market seems to be calling the Fed’s bluff here, as the latest omicron variant will surely provide some uncertainty in the near term, given it is vastly more contagious than delta. Despite the fact that omicron may be a far weaker variant than delta (good news), the pace in which it spreads may have negative impacts on the economy due to larger portions of the workforce being forced to isolate. It could also bring stress to the healthcare sector purely due to the number of people due to be infected, which could lead to further lockdowns globally, and the need for more economic stimulus.
The gold market is basically saying that it doesn’t believe the Fed can normalise rates and end QE in the current environment and I for one would agree with the market at this point. Don’t underestimate the importance of the move back above $1800 here, as it is happening during the most hawkish Fed commentary we have seen in the recent past.
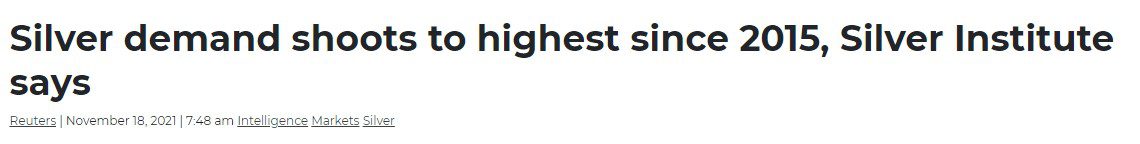
Not a very good year for silver price performance, but a good year for actual demand. Silver industrial demand continues to gain pace year on year, as the market is set to rise to 1.029 billion ounces of demand for 2021, which would mark the first year since 2015 that demand exceeded the billion ounce level. With silver supply usually a fairly consistent 1 billion ounces per year, this calendar year will also mark the first since 2015 that the market hit a supply deficit of some 7 million ounces.
Industrial demand for physical silver should continue to grow throughout the next few years with increased renewable energy commitments by governments and the rise of electric vehicles. Just the automotive sector by itself should start to contribute circa 90 million ounces per annum by the year 2025 and even more as we move into 2030. This represents almost 10% of silver demand globally so we could see the market fall further into a supply deficit if the supply side stays constant. Consistent supply deficits as we move into 2025 should act as a strong tailwind for silver prices.
For those wondering why silver managed to finish in the red for the calendar year despite demand exceeding supply, you have to remember that the price more than doubled from the lows of March 2020, so in retrospect I think it has held up quite well since. The silver market right now is looking quite similar to the setup in palladium a few years ago, where the market was driven into a supply deficit due to higher industrial demand. This then lead to investors flooding into the metal for a speculative play. This further impacted the supply of metals and lead to the market seeing significant price gains on somewhat of a supply squeeze. We saw something similar on a smaller scale in February this year with the silver squeeze movement, but the majority were looking for quick gains and many would have left the market shortly after. Silver needs to be seen as a long term strategic position in the portfolio as industrial demand and EV demand will start growing rapidly between now and 2030.
Until next time,
John Feeney
If you have any feedback or questions about this report, you can contact John Feeney direct at johnf@guardianvaults.com.au
Or on Twitter @JohnFeeney10
Disclaimers: Guardian Gold, Registered Office, Scottish House, 100 William Street, Melbourne, Victoria, 3000. ACN 138618176 (“Guardian Vaults” & “Guardian Gold”) All rights reserved. Any reproduction, copying, or redistribution, in whole or in part, is prohibited without written permission from the publisher and/or the author. Information contained herein is believed to be reliable, but its accuracy cannot be guaranteed. It is not designed to meet your personal situation. Guardian Gold, its officers, agents, representatives and employees do not hold an Australian Financial Services License (AFSL), are not an authorised representative of an AFSL and otherwise are not qualified to provide you with advice of any kind in relation to financial products. If you require advice about a financial product, you should contact a properly licensed or authorised financial advisor. The information is indicative and general in nature only and is prepared for information purposes only and does not purport to contain all matters relevant to any particular investment. Subject to any terms implied by law and which cannot be excluded, Guardian Gold, shall not be liable for any errors, omissions, defects or misrepresentations (including by reasons of negligence, negligent misstatement or otherwise) or for any loss or damage (direct or indirect) suffered by persons who use or rely on such information. The opinions expressed herein are those of the publisher and/or the author and may not be representative of the opinions of Guardian Gold, its officers, agents, representatives and employees. Such information does not take into account the particular circumstances, investment objectives and needs for investment of any person, or purport to be comprehensive or constitute investment or financial product advice and should not be relied upon as such. Past performance is not indicative of future results. Due to various factors, including changing market conditions and/or laws the content may no longer be reflective of current opinions or positions. You should seek professional advice before you decide to invest or consider any action based on the information provided. If you do not agree with any of the above disclaimers, you should immediately cease viewing or making use of any of the information provided.